7/23/2023 - 7/29/2023
Climate in the News:
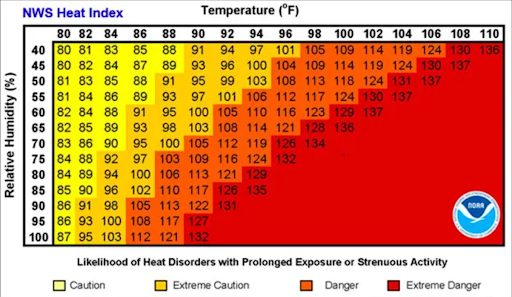
As excessive heat continues to plague the region through the end of this month, different media sources are starting to report the number of record-breaking days of heat experienced this summer. While air temperature (dry bulb temperature) can certainly shed light on this prolonged heatwave, looking at wet bulb temperatures gives one an understanding of not only how hot it feels but also how it can affect the human body. The American Meteorological Society defines wet-bulb temperatures as follows: “Isobaric wet-bulb temperature: the temperature an air parcel would have if cooled adiabatically to saturation at constant pressure by evaporation of water into it, all latent heat being supplied by the parcel.” In simpler terms, wet-bulb temperature is influenced by both temperature and humidity.
So, if wet-bulb and dry-bulb temperatures become closer this summer, the effects of heatstroke only increase as the human body produces sweat to cool down. However, with higher humidity being observed, the air cannot effectively evaporate the sweat and provide relief from the oppressive heat.
Weather Synopsis:
To best comprehend the wet-bulb temperature, it is helpful to consider values that are easily understood: temperature and relative humidity, both of which are commonly displayed or can be calculated from weather stations across the globe. Relative humidity is the ratio of the amount of water vapor in the air to the maximum amount of water vapor required for that air to be saturated.
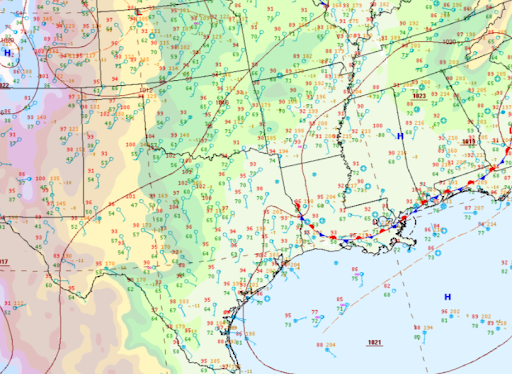
One can utilize their understanding of relative humidity to facilitate a clearer grasp of wet bulb temperature. The wet bulb temperature will always be lower than the dry bulb temperature, but when the relative humidity is 100%, the numbers will be identical. Some other relationships include the following: the higher the temperature, the higher the wet bulb temperature, and the higher the dew point temperature, the higher the wet bulb temperature. Thus, examining the surface analysis below, areas with high temperatures and high dew points permit the highest wet bulb temperature. We can observe some of the moistest areas, particularly near the Gulf of Mexico, as southerly winds bring warm, moist air onshore.
Temperature:
Overall, summer days in July are hot across most of the region. It is hot both during the day and at night for most areas, with high humidity levels near the coast due to the prevailing southerly winds that bring moisture from the Gulf of Mexico.
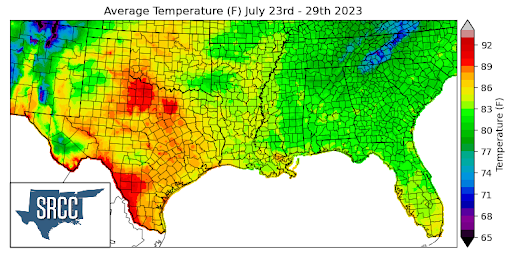
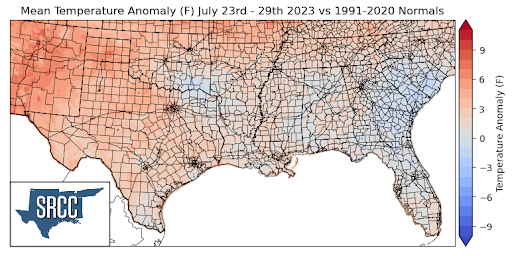
As this prolonged heatwave continues across the southern United States, extreme heat warnings and advisories are no stranger to the southern climate region. A high-pressure center was located for much of the week around New Mexico and the Texas Panhandle, bringing with it above-average temperatures for much of the western portion of the climate region. Daily average temperatures reached as high as 92 degrees Fahrenheit in areas of North and South Texas. Overall, though, daily average temperatures were in the 80s for the majority of the region. Almost the entirety of the climate region experienced above-average temperatures last week, ranging from anomalies 7 degrees greater than normal in the Texas Panhandle to near-normal temperatures in central Mississippi. While the majority of the region saw temperatures at or above normal, a small portion of southeastern Oklahoma saw some slight negative temperature anomalies.
Precipitation:
With the majority of the region being in a humid subtropical climate, rainfall is common at any point of the year. Frequently, during the summer months, sea breezes initiate thunderstorms and rain showers, which are quite common along the coastal areas.
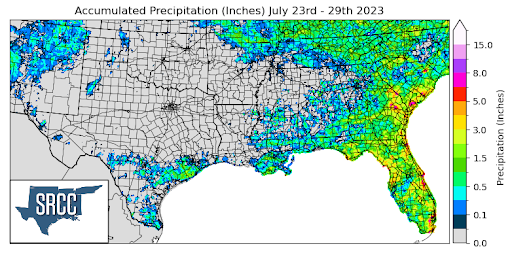
Precipitation was scarce across the southern climate region last week; clear and sunny skies dominated the weather due to the effects of the high-pressure system just to the west of Texas. Due to these dry conditions, accumulated precipitation across the region averaged about less than 0.1 inches.
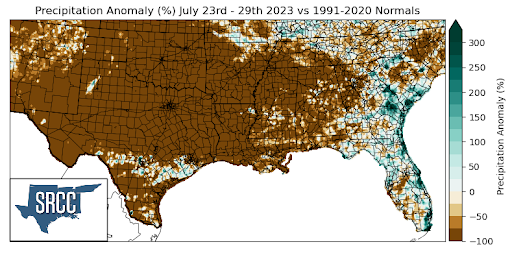
No regions really saw any sizable positive precipitation anomalies, but a few isolated areas did experience negative anomalies. Areas that received near-normal precipitation amounts were a belt in South Texas and Northeastern Tennessee.
Many areas of Texas remained dry into this past week, and the rest of the climate region joined them with negative precipitation anomalies. As a result, the majority of Texas, Oklahoma, Louisiana, Arkansas, Mississippi, and Western Tennessee saw precipitation anomalies around -100%.
Records/Extremes:
- 7/23/23: College Station, TX: Record High Minimum Broken with Daily Low of 82°F
- 7/23/23: East New Orleans, LA: 64 mph winds
- 7/24/23: Jackson County, TX: 3.5 inches of rain via CoCoRaHS submission
- 7/26/23: El Paso, TX: Record Daily High Temperature at 108°F
- 7/29/23: Mount Carmel, TN: 1.0 inch hail